Monitoring
Monitoring answers three questions: did it run, what did it do, and who asked for it.
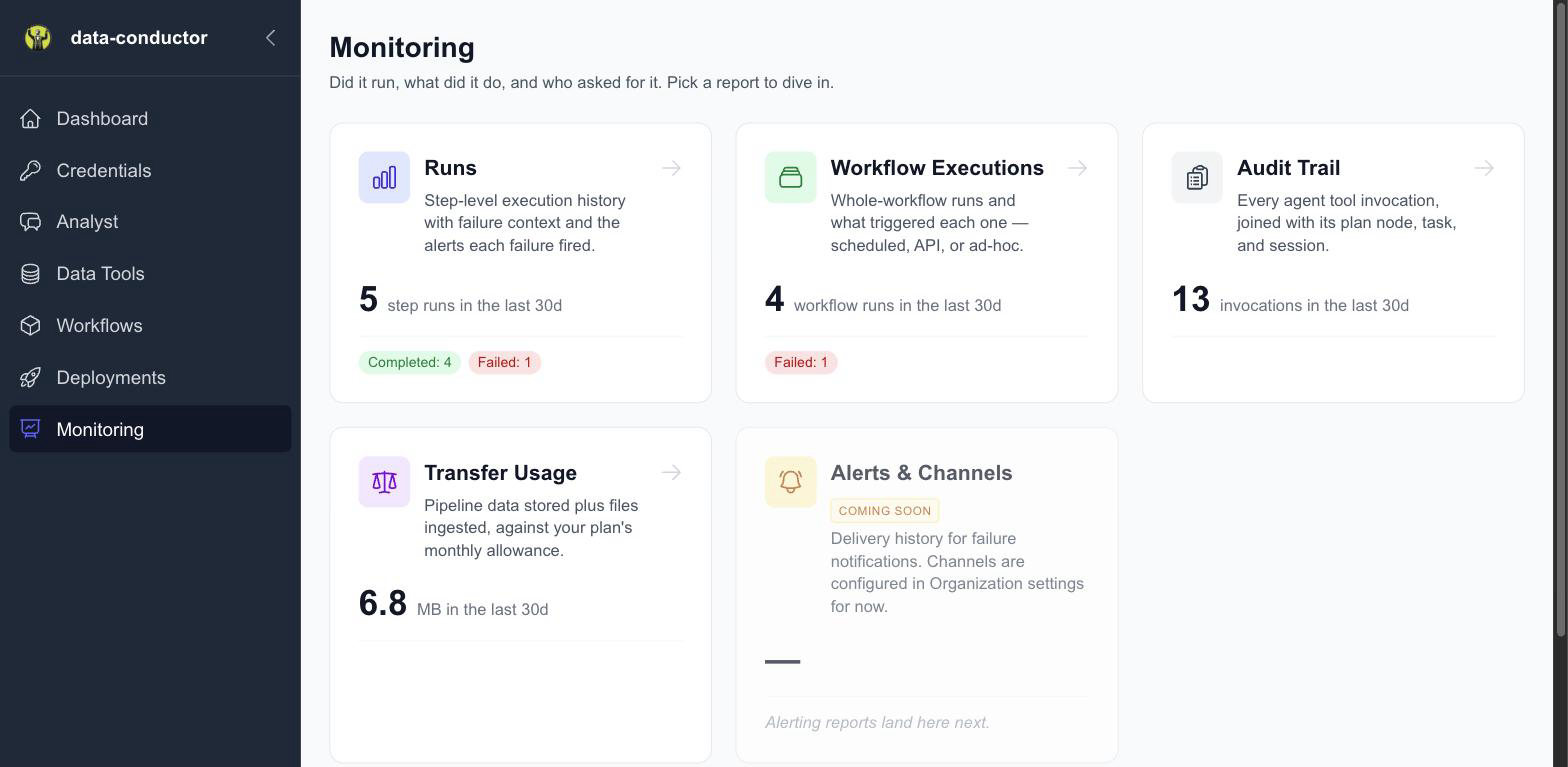
The reports
| Report | Grain | Use it for |
|---|---|---|
| Runs | One row per step | Which step failed, and why — full error text and the alerts it fired |
| Workflow Executions | One row per workflow run | Did the pipeline run, what triggered it, how long it took |
| Audit Trail | One row per agent action | What the Analyst did on your behalf, and what it cost |
| Transfer Usage | Rolled up per org | Data moved against your plan's allowance |
Runs and Workflow Executions are two views of the same activity at different altitudes. Start at Executions to see whether a pipeline ran; drop to Runs when you need to know which step inside it broke.
Runs
Filter by time window and status. Clicking a row opens the full failure context: the error class and message, raw output where available, and which notification channels fired.
Rows link through to the complete execution timeline for that job.
Workflow Executions
Shows what triggered each run:
- Scheduled — fired by its CRON deployment
- API — triggered through an API deployment
- Ad-hoc — run manually
Clicking a row opens the step-by-step timeline.
Audit Trail
Every action the Analyst takes, joined to the session and the user who asked. The token column reports usage for the whole task an action belongs to, so several rows from one task repeat the same figure — don't sum the column.
Transfer Usage
Data moved in the last 30 days, split between pipeline data and file uploads, shown against your plan's allowance, with the pipelines consuming most. This report is informational — nothing is blocked when you go over.
Related
- Deployments
- Organization Settings — alert channels