Dashboard
The Dashboard is where you land after signing in. It answers one question at a glance: is everything running the way it should be?
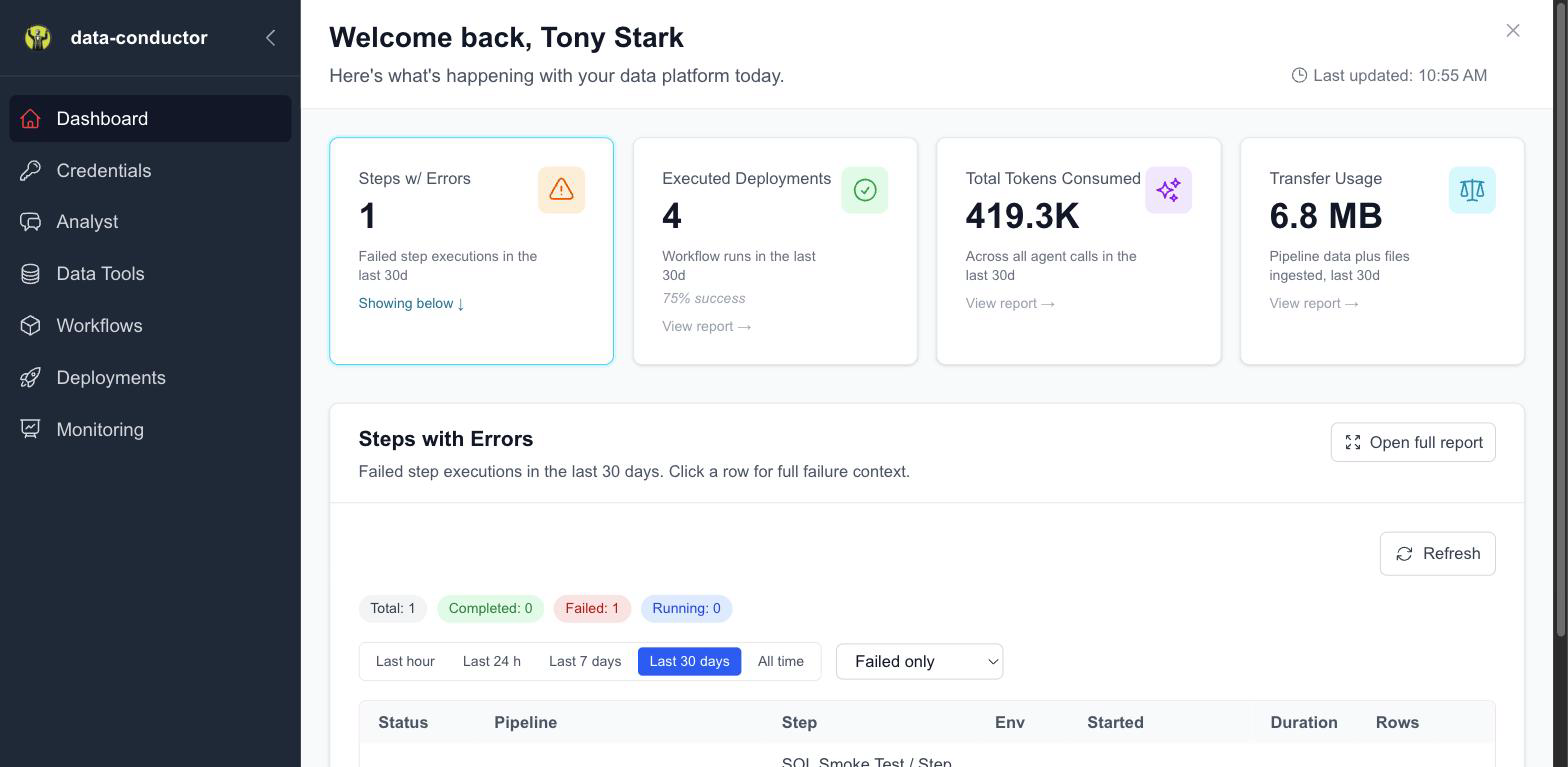
The stat row
Four cards summarise the last 30 days. Each one is also a control — click a card and the report behind it opens in the panel below, so the number and the detail that explains it are never more than one click apart.
| Card | What it counts | Opens |
|---|---|---|
| Steps w/ Errors | Failed step executions in the last 30 days | Runs, filtered to failures |
| Executed Deployments | Workflow runs in the last 30 days | Workflow Executions |
| Total Tokens Consumed | AI tokens used across all agent calls | Audit Trail |
| Transfer Usage | Pipeline data stored plus files ingested | Transfer Usage report |
All four use the same 30-day window so the figures can be read against each other.
The panel
Below the cards, the selected report renders in place. It opens on Steps w/ Errors — failures are the thing worth seeing first — and each report also has a full-page version, linked from the panel header.
That default report is Runs, pre-filtered to failures over the same 30 days, so you land on what broke rather than on a list of everything.
To manage deployments themselves — pausing, rescheduling, changing a pinned version — go to Deployments in the sidebar. The Dashboard panels are read-only views.
Getting started callout
Until your organization has a connection and a data step, a short callout appears above the stat row pointing at the next thing to do. It disappears on its own once you're set up.
Related
- Monitoring — the full reports
- Deployments — creating and managing schedules